

- - MicrotracBEL
- - Grabner
- - Iludest
- - AD Systems
- - Porometer
- - Fueltech
- - Orbis
- - Hydramotion
- - Gibertini
- - Mercury Instrument
- - Paragon Scientific
- - Rubolab
- - Normalab
- - Green Lab
- - Tanaka
- - Forza International
- - Carbolite Gero
- - Adscientis

- - 흡착 (adsorption)
- - 석유화학 (petrochemical)
- - 열중량분석 (TG)
- - 멤브레인 (membrane)
- - 증류 (distillation)
- - 점도 (viscosity)
- - 와인학 (oenology)
- - 실험실 (lab instrument)
- - 촉매특성평가 (TPD/TPR)
- - 연료전지성능평가(Fuel cell)
- - 반응기(Micro-Reactor)
- - 가스분석기(Mass spectrometer)
- - 수은분석 (mercury)
- - 표준시약 (CRM, SRM)
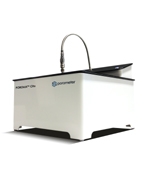 |
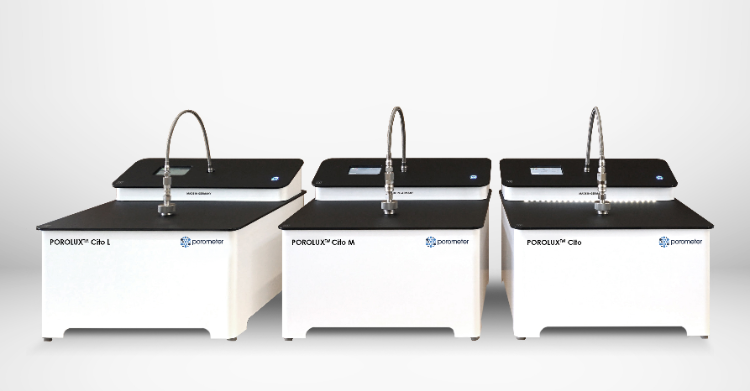
POROLUX™ Cito M, L |
Capillary flow porometer for QC |
|
 |
|
| Features | |
|
2022년 12월 부로 Porometer사 장비 모델명이 아래와 같이 변경되었으니 참고 부탁드립니다.
변경 전 변경 후 POROLUX™ 50 POROLUX™ BP POROLUX™ 100 POROLUX™ Cito L POROLUX™ 200 POROLUX™ Cito M POROLUX™ 500 POROLUX™ Cito POROLUX™ 1000 POROLUX™ Revo POROLIQ™ 1000 AQ POROLIQ™ AQ POROLIQ™ 1000 ML POROLIQ™ ML
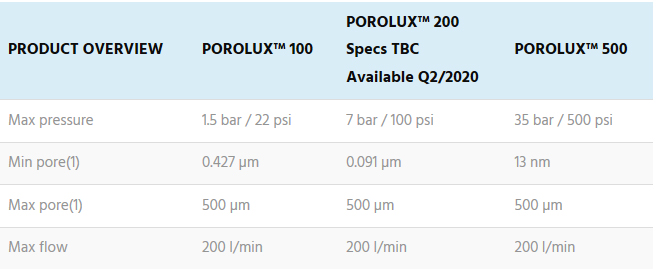
POROLUX™ 100The POROLUX™ 100, 200 and 500 are gas liquid porometers based on the pressure scan method developed for the rapid measurement of through-pores in materials such as filters, nonwovens, textiles, paper, membranes, hollow fibres, etc.
PRESSURE AND FLOW RATES RANGEThe pressure scan-series contains instruments with pressure levels that go up to 1.5 bar (22 psi), such as the POROLUX™ 100, or go up to 35 bar (500 psi), such as the POROLUX™ 500. The maximum flow rate can be 200 l/min. For details please see the table of specifications for each model.
KEY FEATURES•Gas-liquid displacement porometer based on the pressure scan method: the applied pressure and the resulting gas flow are measured continuously.
PARAMETERS MEASURED
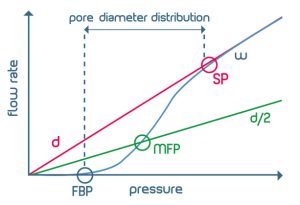
Measuring curves and resulting parameters in CFP (w = wet curve, d = dry curve, d/2 = half-dry curve, FBP = largest pore, MFP = mean flow pore, SP = smallest pore)
In a typical CFP test a flow of pressurized gas is applied to the porous sample impregnated with the wetting liquid and the flow of gas through the sample, as the liquid is displaced out of the porous network, is measured. The “wet curve” represents the measured gas flow against the applied pressure.
Following the wet curve, the gas flow against the applied pressure on the dry sample (“dry curve”) is also measured. From data from the wet curve, the dry curve and the “half-dry curve” (dividing the flow values of the dry curve by 2) information about the porous network can be obtained.
•Bubble point
•Smallest pore size
•Mean flow pore diameter
•Gas permeability
•Cumulative filter flow [SUM]
•Differential filter flow [DIF]
•Pore size flow distribution [CDIF]
|
|